Introduction -This is a comprehensive, expert-level guide on reducing the memory footprint in.NET Core microservices, specifically optimized for modern environments like .NET 8 and .NET 9.
Optimizing.NET Microservices: Comprehensive Guide to Reducing Memory Footprint
In a microservices architecture, scalability and cost-efficiency are directly tied to how lean your services are. When running hundreds of containers in a Kubernetes (K8s) cluster, even a 50MB reduction in memory per instance can lead to significant infrastructure savings and better application stability.
With the release of .NET 9, Microsoft has introduced revolutionary changes like DATAS, making it easier than ever to manage memory dynamically. This guide explores high-level strategies for senior developers to minimize memory usage.
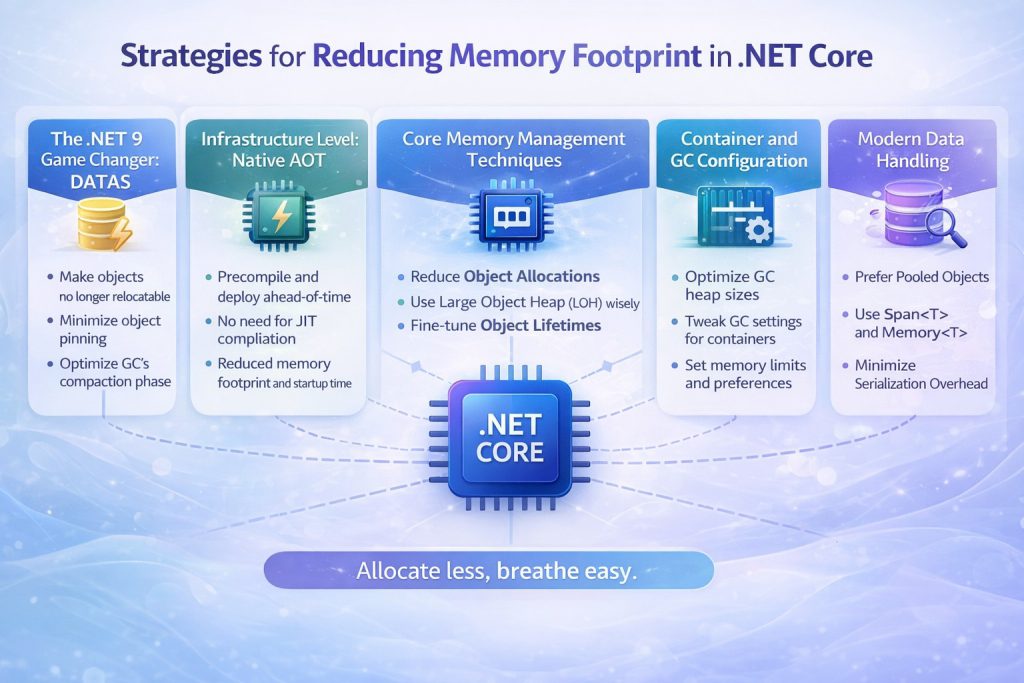
- The.NET 9 Game Changer: DATAS
The most significant update in.NET 9 is the introduction of Dynamic Adaptation to Application Sizes (DATAS), which is now enabled by default.
- How it works: Unlike the traditional Server GC, which aims for maximum throughput and often keeps the heap large even after traffic subsides, DATAS adapts the heap size to the actual volume of long-lived data.
- The Benefit: It allows the heap to shrink when the workload becomes lighter, releasing memory back to the operating system faster. In microservices with “bursty” traffic, this ensures that memory usage doesn’t stay artificially high after a spike.
- Observation: You can monitor this in real-time using dotnet-counters by watching gc-heap-size and gc-committed-bytes decrease as load drops.
2. Infrastructure Level: Native AOT
For microservices that require instant startup and the lowest possible memory overhead, Native Ahead-of-Time (AOT) compilation is the gold standard
- No JIT Overhead: Native AOT compiles your code directly into platform-specific machine code at publish time. This eliminates the need for the Just-In-Time (JIT) compiler and the Intermediate Language (IL) engine to reside in memory.
- Measured Impact: Native AOT can reduce memory consumption by up to 40% compared to traditional JIT-compiled apps. It is particularly effective for Minimal APIs, gRPC services, and Worker Services.
- Reduced Footprint: Because unused code is automatically trimmed, the final executable is self-contained and significantly smaller.
- Core Memory Management Techniques
Beyond framework-level settings, your coding patterns dictate how much memory is allocated on the heap.
A. Zero-Allocation with Span and Memory
Traditional string and array operations (like Substring or ToArray) create temporary copies of data on the managed heap.
- The Solution: Use Span to create “windows” over existing memory without copying data.
- Example: When parsing a string or processing a network buffer, slicing a Span involves no new heap allocation, reducing the pressure on the Garbage Collector (GC).
B. Reuse Buffers with Array Pool
Frequently allocating large arrays (especially those over 85,000 bytes) can lead to Large Object Heap (LOH) fragmentation. LOH is only collected during Gen2 GCs, which are expensive. - The Solution: Use ArrayPool.Shared.Rent(size) to “borrow” an array from a thread-safe pool and Return() it when finished.
- Result: Production systems using ArrayPool have reported up to a 54% reduction in daily memory usage and 75% fewer Gen2 collections.
4. Container and GC Configuration
In containerized environments like Docker and Kubernetes, the.NET runtime must be configured to respect container limits.
- Heap Hard Limits: Use environment variables like DOTNET_GCHeapHardLimitPercent (defaulting to 75% in containers) to ensure the GC triggers before the container hits its K8s memory limit and gets OOM-killed.
- Server vs. Workstation GC: For high-density hosting where memory is scarce but CPU usage is relatively low, consider switching to Workstation GC to reduce the initial memory reservation.
5. Modern Data Handling
- System.Text.Json: Always prefer System.Text.Json over Newtonsoft.Json. It is designed for high performance and low allocation, utilizing Span internally for faster serialization.
- System.IO.Pipelines: For high-throughput I/O (like network streaming), use Pipelines to manage buffers automatically and minimize memory copy operations.
6. Monitoring and Benchmarking
You cannot optimize what you cannot measure.
- Benchmark Dotnet: Use the “ attribute to track exact allocations for your methods during development.
- dotnet-counters: Monitor live metrics such as the Allocation Rate and Working Set in production environments.
- dotnet-dump: If you suspect a memory leak, use dotnet-dump analyze with the dumpheap -stat command to identify which objects are occupying the most memory.
Conclusion
Reducing memory footprint is a multi-layered approach. By leveraging .NET 9’s DATAS for dynamic scaling, Native AOT for lean infrastructure, and Span/ArrayPool for efficient code, you can build highly resilient microservices that perform optimally in resource-constrained cloud environments.
Pro-Tip for your blog: You can add a small GitHub link to a sample project showing a BenchmarkDotNet comparison between a traditional string.Split and a Span-based parsing logic. This will act as great social proof for your readers.