Introduction of data flow diagram -: Data flow diagram is a graphical representation of flow of data in an information system. It is capable of depicting incoming data flow outgoing data flow and stored data. The DFD does not mention anything about how data flows through the system.
Flowchart v/s Data flow diagrams-: The difference between data flow diagram and flowchart is the flowchart depicts flow of control in program modules and data flow diagrams depict flow of data in the system at various levels. It does not contain any control or branch elements.
Types of data flow diagram -: There are two type of data flow diagram. It may be logical and physical.
- Logical Data Flow Diagram-:in this type DFD concentrates on the system process an flow of data in the system.For example in the banking software how many data are moved between different entries.
- Physical data flow diagram -: This type DFD show how many data flow is actually implemented in the system. It is more specific and close to the implementation.
Data flow Diagram components-: we know that the DFD is a graphical representation of data. DFD represent source, destination, storage and flow of data using as like entities, process.etc. as like here
- Entities –: Entities are source and destination of information of data. entities are represent be rectangles withe their respective names.
- Process -: Activities and action taken on the data are represented by circle or round edged rectangles.
- Data storage -: there are two variants of data storage. It can either be represent as a rectangle with absence of both smaller sides or as an open sided rectangle with only one side missing.We can say that is a ware house of data.
- Data flow-: Moving of data is showing by pointed arrows. data movement is shown from the base of arrow as its source towards head of the arrow as destination.
Level of Data Flow Diagram-: The data flow start with the 0 level. This is divide in level. These level are the
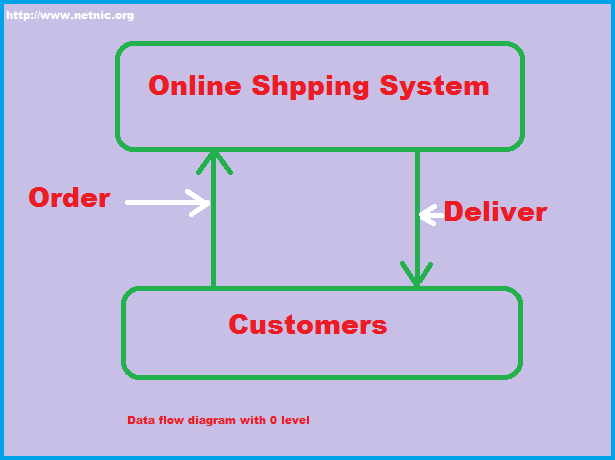
Level 0-: The highest abstraction level DFD is known as level 0 DFD which depicts the entire information system as one diagram concealing all the underlying details. 0 levels data flow diagram are also known as context level Data flow diagrams. For example in online shopping system order comes and goods deliver to the customers.
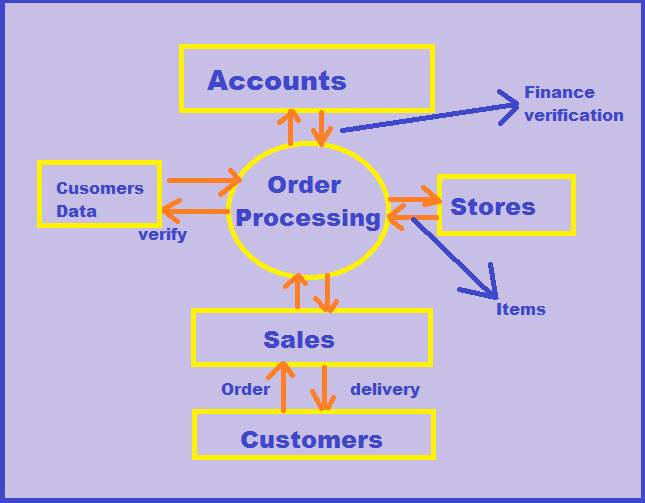
Data Flow Diagram Level 1-: This level 0 DFD is broken down into more specific, Level 1 DFD. Level 1 DFD depicts basic modules in the system add flow of data among various modules. Level 1 DFD also mentions basic processes and sources of information.
Data flow Diagram Level 2 -: in this level DFD show how data flows inside the modules mention in level 1. Higher level DFD can be transformed into more specific lower level DFD with deeper level of understanding unless the desired level of specification is achieved.
Structure Charts -: It is a chart derived from data flow diagram. It represent the system in more detail than DFD.It breaks down the entire system into lowest functional modules describes function and sub function of each module of the system to a greater than DFD. structural chart represent hierarchical structure of modules. At each layer a specific task is performed. There are some symbol used in construction of structure chart. These are the
1-: Module-: A control module branches to more than one sub -module. Library are reusable and invaluable from any module.
2- Condition -: It is represent by small diamond at base of the module. It depicts that control module can select any of sub-routine based on some condition.
3-: Loop-: A curved arrow represent loop in the module. All sub module covered by loop repeat execution of module.
4-Jump-: An arrow shown pointing inside the module to depict that the control will jump in the middle of the sub module.
5. Data flow -: a directed arrow with empty circle at the end represent data flow
6.- control flow -: This flow is directed with filled circle at the end represents control flow.